
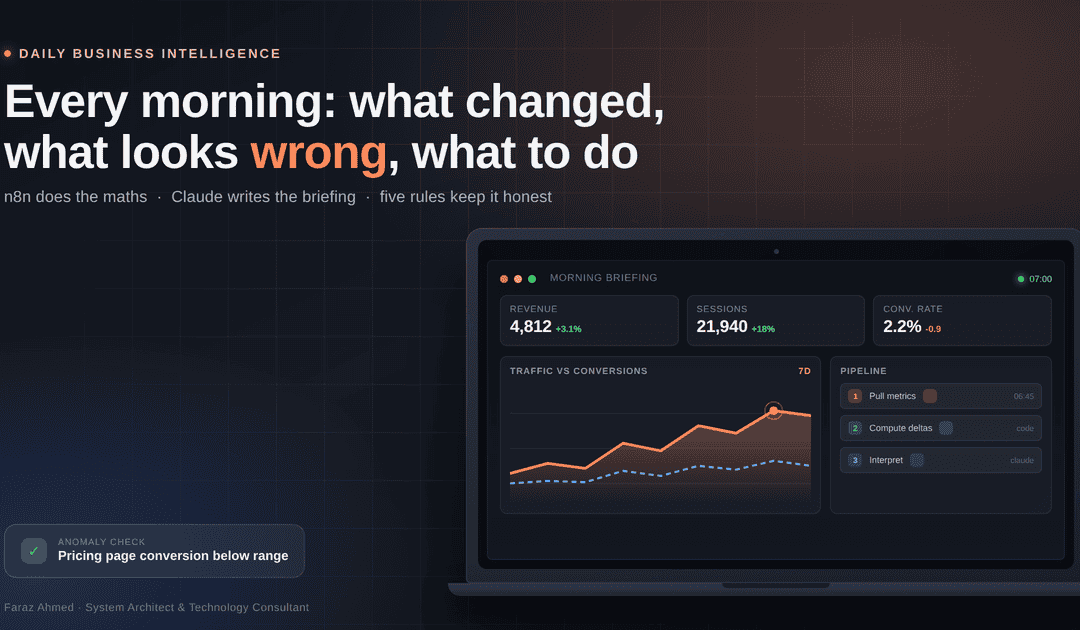
Every morning I get insights, action items and anomalies from analytics, servers and CRM, and the marginal cost is under a dollar a month
Faraz Ahmed · System Architect & Technology Consultant · Karachi
I have been building systems for 25 years. Over 500 clients across Pakistan, the UAE, Canada and the US. Hosting, cPanel, WordPress, aMember, SEO tools, now AI agents.
You would think that means I look at my own numbers. I did not.
Here is my real Monday: a hosting panel with disk graphs. A backup destination with retention numbers. A billing system with subscription counts. Three analytics properties. A CRM. A support inbox. A refunds sheet my assistant keeps.
Every one of them has a dashboard. Every dashboard has a dozen charts. I would open four or five, scroll, nod, close the tabs, and carry a vague feeling that I had checked something.
Then I found out, weeks late, that a client domain had been dead for days. The zone existed. The records were intact. The registrar's nameservers were pointing at the wrong Cloudflare pair, so the entire zone was answering REFUSED while my panel showed everything green.
The data was there the whole time. Nobody was reading it.
What I actually needed
Not another dashboard. A reader.
Three questions, every morning:
- What changed?
- What looks wrong?
- What do I do about it today?
That is it. Not twenty metrics. Three answers.
How it is built
I run it on n8n with Claude in the analysis step. The pattern matters more than the tool.
Step 1: scheduled pulls. Every morning the workflow pulls fresh numbers from each source: server disk and backup state, website analytics, subscription and payment counts, CRM movement, inbox volume, refund notes.
Step 2: calculate before the model sees anything. Every change versus yesterday, versus last week, versus a four-week average is computed in code. Outliers are flagged by rule, not by vibes. Server disk is compared against its guard threshold. Backup sets are compared by file count and size match, not by "did rsync exit zero."
This is the part people get wrong. A language model is a good interpreter and a bad calculator. I do not let it do arithmetic, because I cannot audit arithmetic I did not see.
Step 3: analysis. The prepared numbers go to Claude with a tight brief:
You are a careful operations analyst. Using only the numbers provided, produce: a three-sentence summary, any anomalies with explanations labelled as hypotheses, and the three most useful actions for today. Do not claim causes you cannot support. If a metric is missing, say so instead of interpreting it.
Step 4: delivery. It lands where I already am. WhatsApp at 23:00 for the business briefing. Email for the content pack. A separate 07:00 check for the backup sync. I do not install another app to read my own data.
What a briefing actually looks like
Real output from this week, lightly trimmed:
Backup sync. Set 2026-11-05 moved to destination, 11G. All 43 source files present and size-matched. Destination 2.5T free, 29% used, 4 sets held. Source `/backup` at 86% against a 95% guard. rsync rc 0 at 02:40. Nothing to do.
Anomaly. Two limit-plan rows carried junk metric keys `0` and `1` alongside the real `messages` and `tokens` rows. Admin screen rendered the junk, so the real quota was invisible. Hypothesis: legacy migration artefact. Confirm by checking `plan_metric_limits` for other tools.
Action. 1) Delete junk rows. 2) Check whether other tools have the same artefact. 3) Re-verify the admin grid.
I read that in two minutes and fixed a live billing problem in five. Most days it says "all normal", and that is the point.
The day it paid for itself
A limit system I had configured was not enforcing anything. The quotas were in the database. The admin screen showed them. But the client never called the quota API before letting a request through, so the limits existed on paper and never applied.
Nobody complained, because nobody notices a limit that does not block.
The morning report surfaced the pattern: usage counters flat while request volume climbed. That mismatch is only visible if you compare two systems against each other. No single dashboard shows it.
Same week, the reverse: a folder-protection cleanup had deleted the marker files that authorise access to a subdomain. Real paying members were being redirected away from the tool they had paid for. Silent. No error, no ticket. Just a 302.
Both were found in the briefing, not in a dashboard.
I will not put a rupee figure on it. Some of those users would have come back anyway. The pattern is what matters: I found two revenue-affecting faults in one week, in minutes, because something compared systems instead of plotting one of them.
The cost, honestly
This is where most articles oversell.
- The automation host: a server I already run for other work. Marginal cost zero.
- The data sources: existing plans that already include API access. Marginal cost zero.
- The model calls: cents. After weeks of heavy testing across two providers, my API line sat at about two dollars total.
So the marginal cost is genuinely under a dollar a month at my volume. But that "free" claim has three conditions: you already own the host, your tools expose an API on your current plan, and your volume stays small. If any of those is false, it is not free, it is cheap. Be honest about which one you are claiming.
Five rules that made the analysis trustworthy
1. The model never does the math. Every number is computed in code first. The model interprets figures that already exist.
2. Hypotheses are labelled. My early versions stated causes as fact: "revenue fell because of the holiday." It had no way to know that. Every explanation now carries the word hypothesis and lists what data would confirm or kill it.
3. Show the raw numbers. Every briefing carries a plain table underneath the prose. If a sentence sounds wrong, I check the table in five seconds.
4. Say "data unavailable". One morning a source failed and the model wrote "Analytics data unavailable" instead of inventing a narrative. That single instruction is worth more than any prompt engineering trick.
5. Keep it under three minutes. If a briefing takes longer to read than opening the dashboards, it is dead within a week.
What went wrong
Confident output from bad input. A sync duplicated records and doubled the new-lead count. The briefing reported a record day. I now run data-quality checks first: record counts against expected ranges, file counts against source counts, zero-byte results treated as failures. If the input fails its own sanity check, the report says so and stops.
Over-alerting. Version one flagged every change above 5%. I got a dozen alerts a day and stopped reading them by day four. Thresholds now follow the cost of missing something, not the size of the percentage.
Secrets in the wrong place. A credentials backup was sitting in a web root with readable permissions. Nothing exploited it, but it was one directory listing away from a very bad week. Everything credential-adjacent now lives outside the docroot at mode 600, and the report checks permissions as part of the run. Credentials stay read-only wherever the provider allows it.
Trusting configuration as proof. My worst habit, and the one this whole system fixed. A config row is not enforcement. A green dashboard is not delivery. A plan is not a result. The agent now has to show me the live request returning the real answer before it gets to say something works.
Results, four months in
- Two revenue-affecting faults caught in the first week: unenforced quota, and broken member access.
- The Monday ritual, roughly 50 minutes of tab-hopping, is now about 5 minutes of reading.
- Decisions move faster because the third section forces me to name the next action instead of "review later."
- The reports are boring on most days, which is exactly what a monitoring system should be.
If you want to build this
- Pick three questions, not twenty metrics.
- Pull them on a schedule and store history. History is what turns a number into a signal.
- Compute the deltas in code. Never ask the model to subtract.
- Brief the model to produce hypotheses and actions, not conclusions.
- Add a data-quality gate before analysis. Garbage in, confident nonsense out.
- Deliver into a channel you already check. A new app is a new thing to ignore.
- Run it two weeks and tune thresholds until silence means something.
Why this works
Small businesses do not lack data. They lack attention.
A briefing agent does not create information. It makes sure the right information reaches you once, in three sentences, before you start your day. It replaces the vague feeling of having checked with an actual answer.
I spent 25 years building systems that other people log into. The most useful one I have built is the one that logs in for me, checks the things I would forget, and tells me the truth about what it found.
Most mornings it says: "All normal. Go build something."
That is the whole product.
Faraz Ahmed is a System Architect and Technology Consultant based in Karachi. He has worked with over 500 clients across Pakistan, the UAE, Canada and the US since 2000, building hosting, SaaS and AI automation systems.